Having real-time analytics on your website is a great way to improve transparency, boost user engagement and keep stakeholders up-to-date on performance.
This is even more critical for mission-driven organizations that continually report back to stakeholders on the impact of their initiatives.
Salesforce dashboards enable users to keep the whole team ontrack with the latest metrics. However, it is only accessible internally to users in the organization who have a login on Salesforce. This means many organizations spend long hours having to do the report exports, formatting csv files, and copy-pasting data multiple times.
Luckily, Salesforce provides APIs (and it’s already available to you!) that can be used to build intuitive apps on top of your data. This lets you share the latest data to other platforms like your WordPress website.
Building apps using APIs usually involves quite a bit of development work – weeks, months (plus maintenance)!
Sawfish plugin automates all of this heavy lifting for you so you can easily set up the metrics from Reports to show on your website with a few clicks. The plugin sets up a secure connection between Salesforce and WordPress using Salesforce APIs so you can access all of your reports as needed from your website.
Just select the report you want to connect to and you can create charts, figures and dashboards in a matter of seconds. No coding or development needed!
You can have these interactive live visualizations both on your WordPress pages and blog posts.
The figures will get updated real-time when changes are made on Salesforce!
You’re thinking ‘this is cool! But what if I still want it on my site but behind a login’.
Yes! That can be easily set up as well. You can also set up custom logins on WordPress for your team – sales agents, volunteers, donors for them to login and check information that’s relevant only to them!
‘I have downloaded the plugin and set up the connection to Salesforce.
What can I create?’
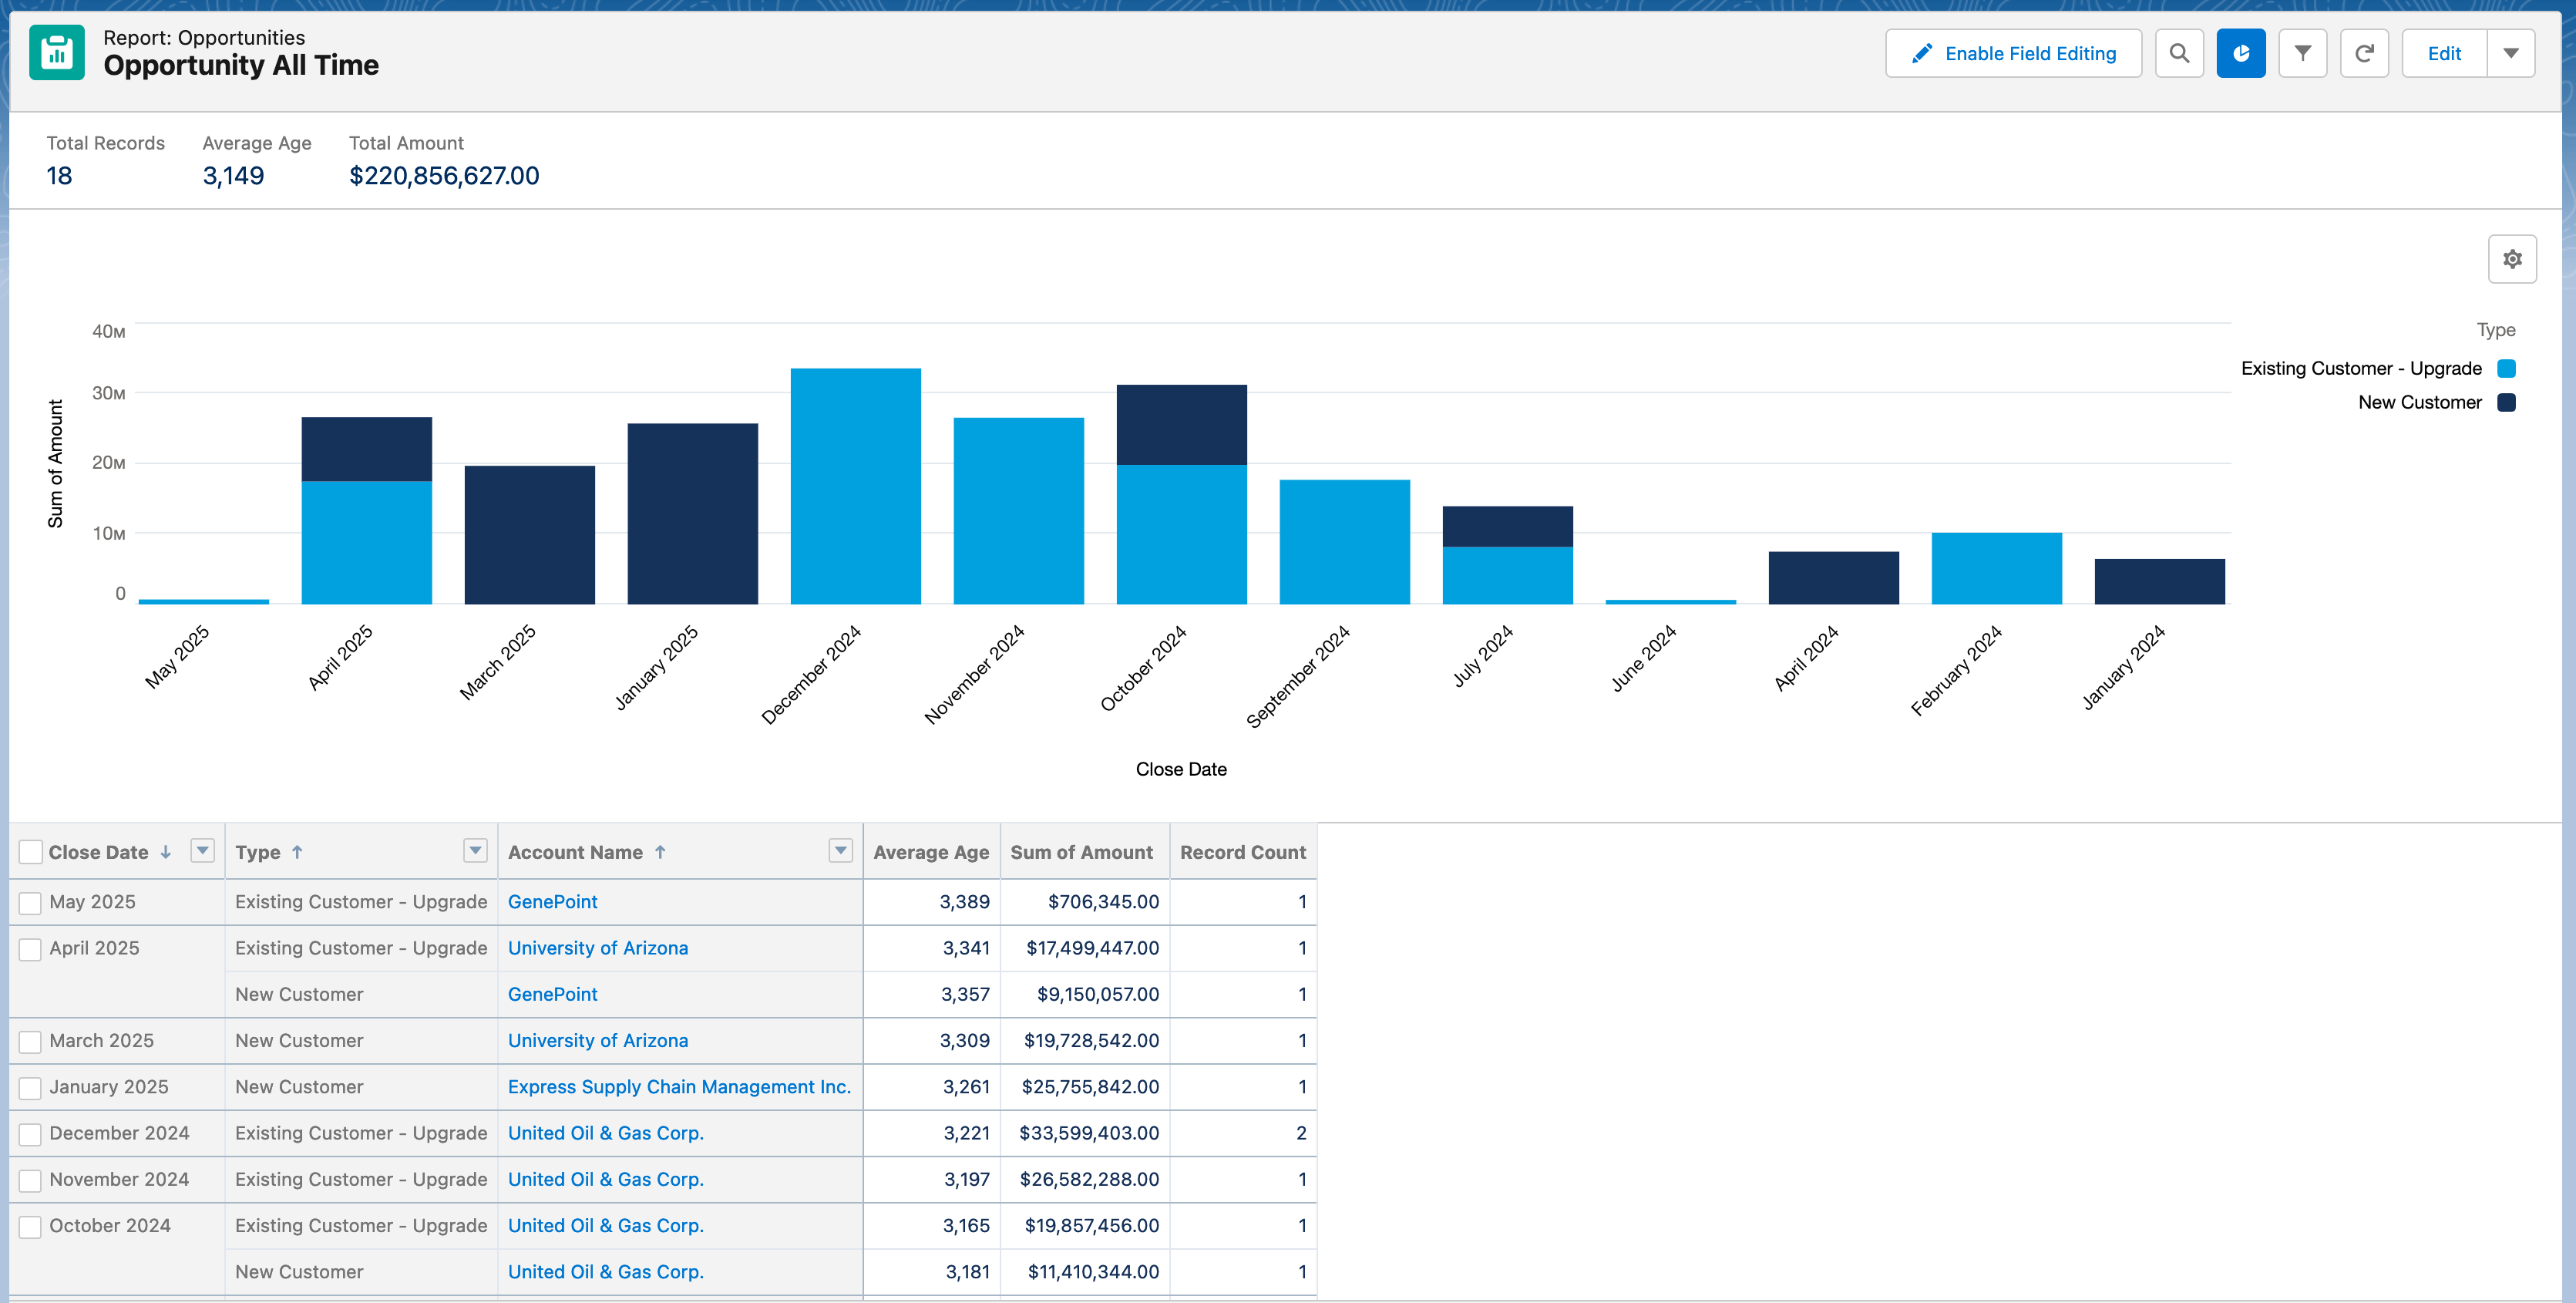
Perfect! Let’s start by selecting a report in Salesforce and creating some charts! If you want to replicate an existing dashboard section, just select the underlying report connected to the element.
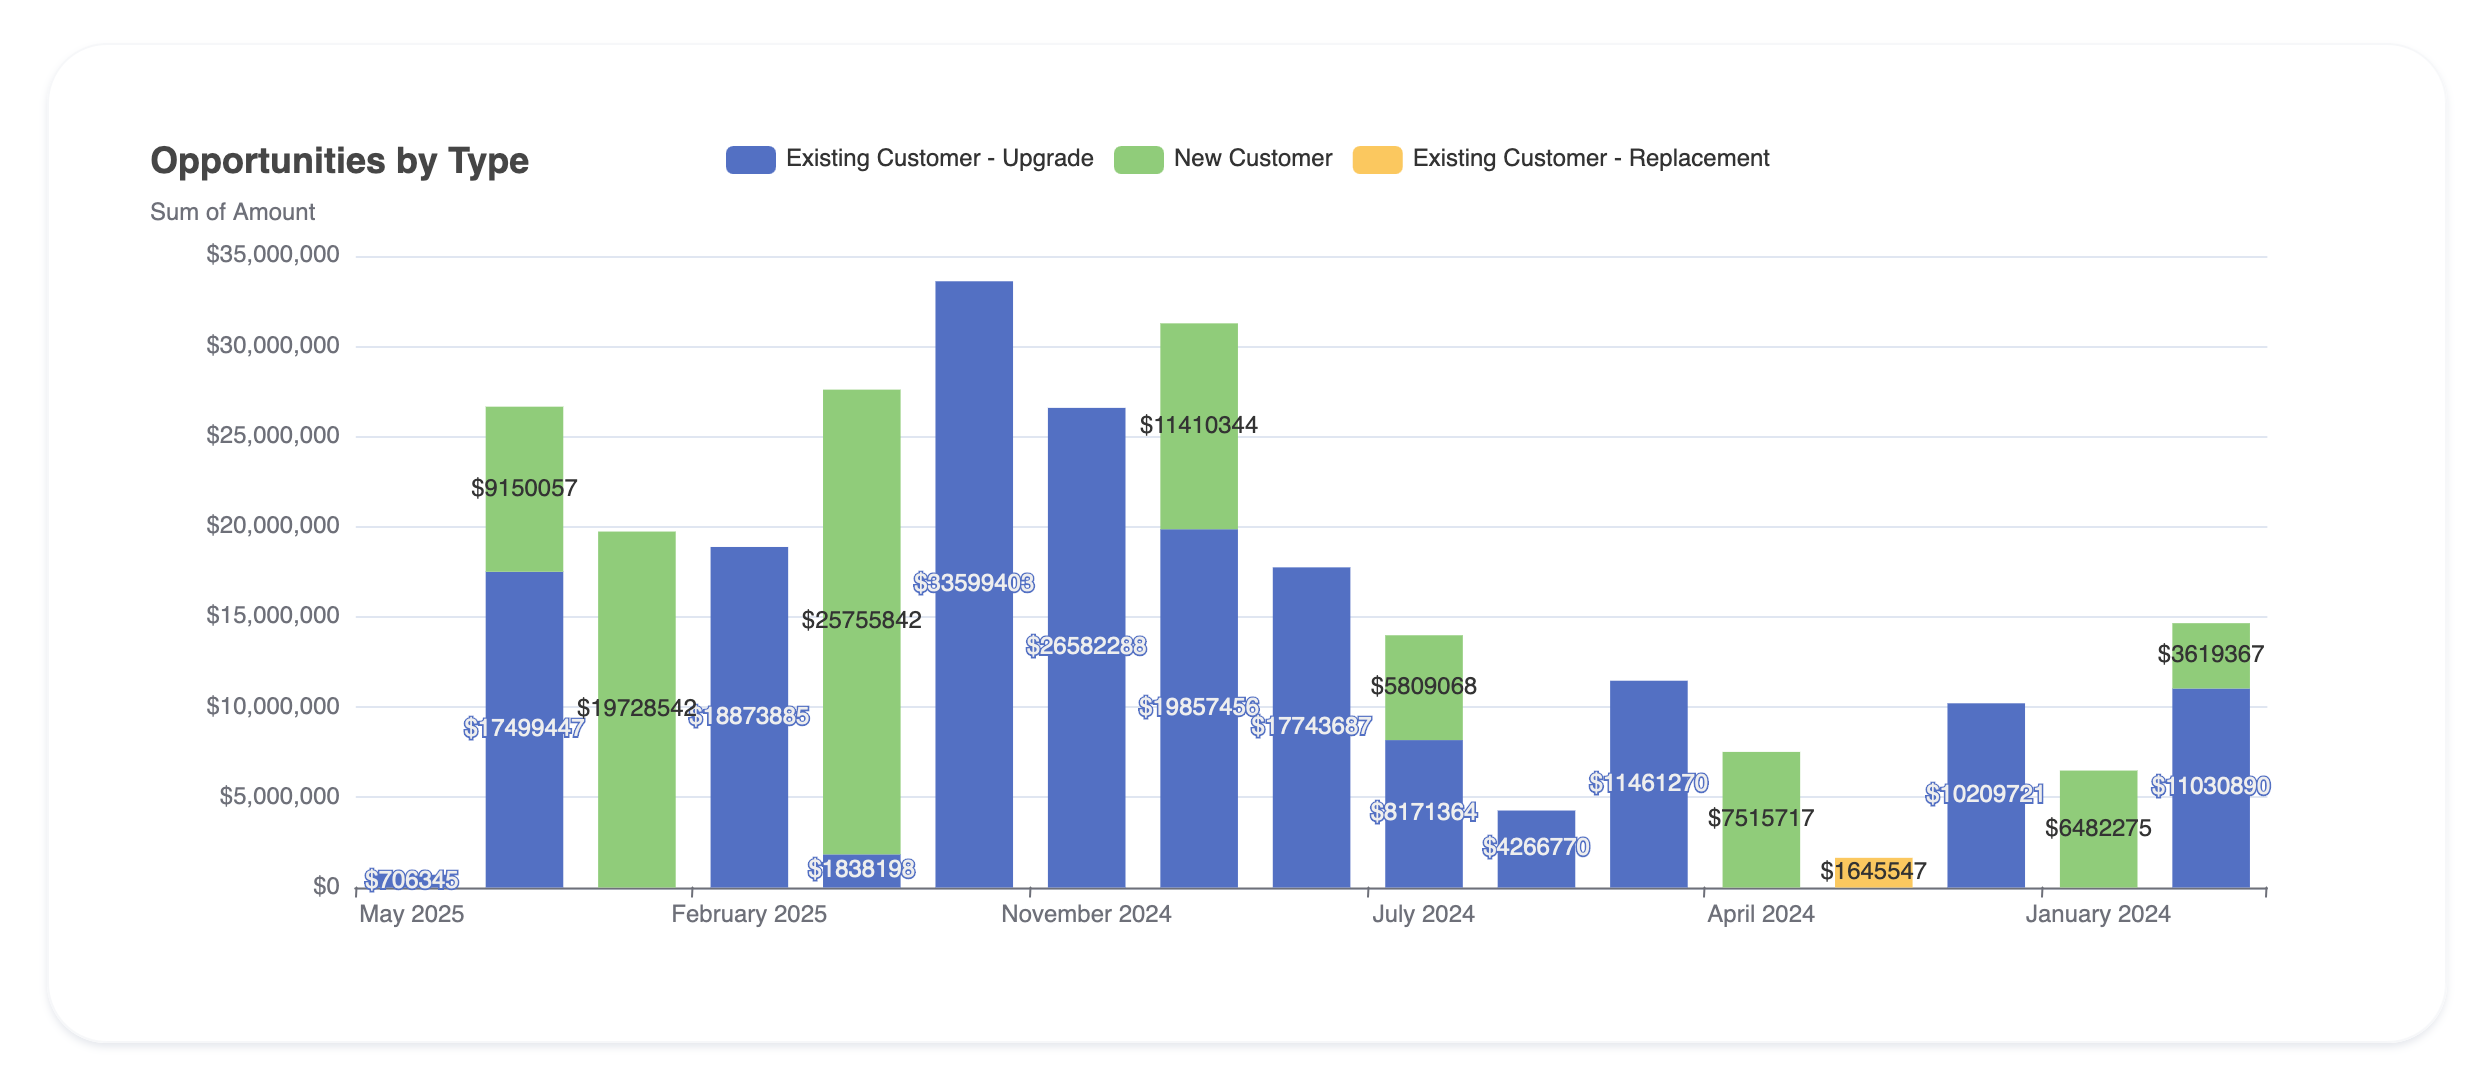
We will use the report below. It is a summarized report on Opportunities and it summarized by the field Opportunity Age and Amoun. The grouped by fields are Close Date, Type and Account Name.
As you go through the options, think of the metrics and reports in your organization that would be perfect for these visualizations!
Types of visualizations you can create on WordPress:
Metrics
Bar
Stacked Group
Line or Area
Gauge
Pie
Donut
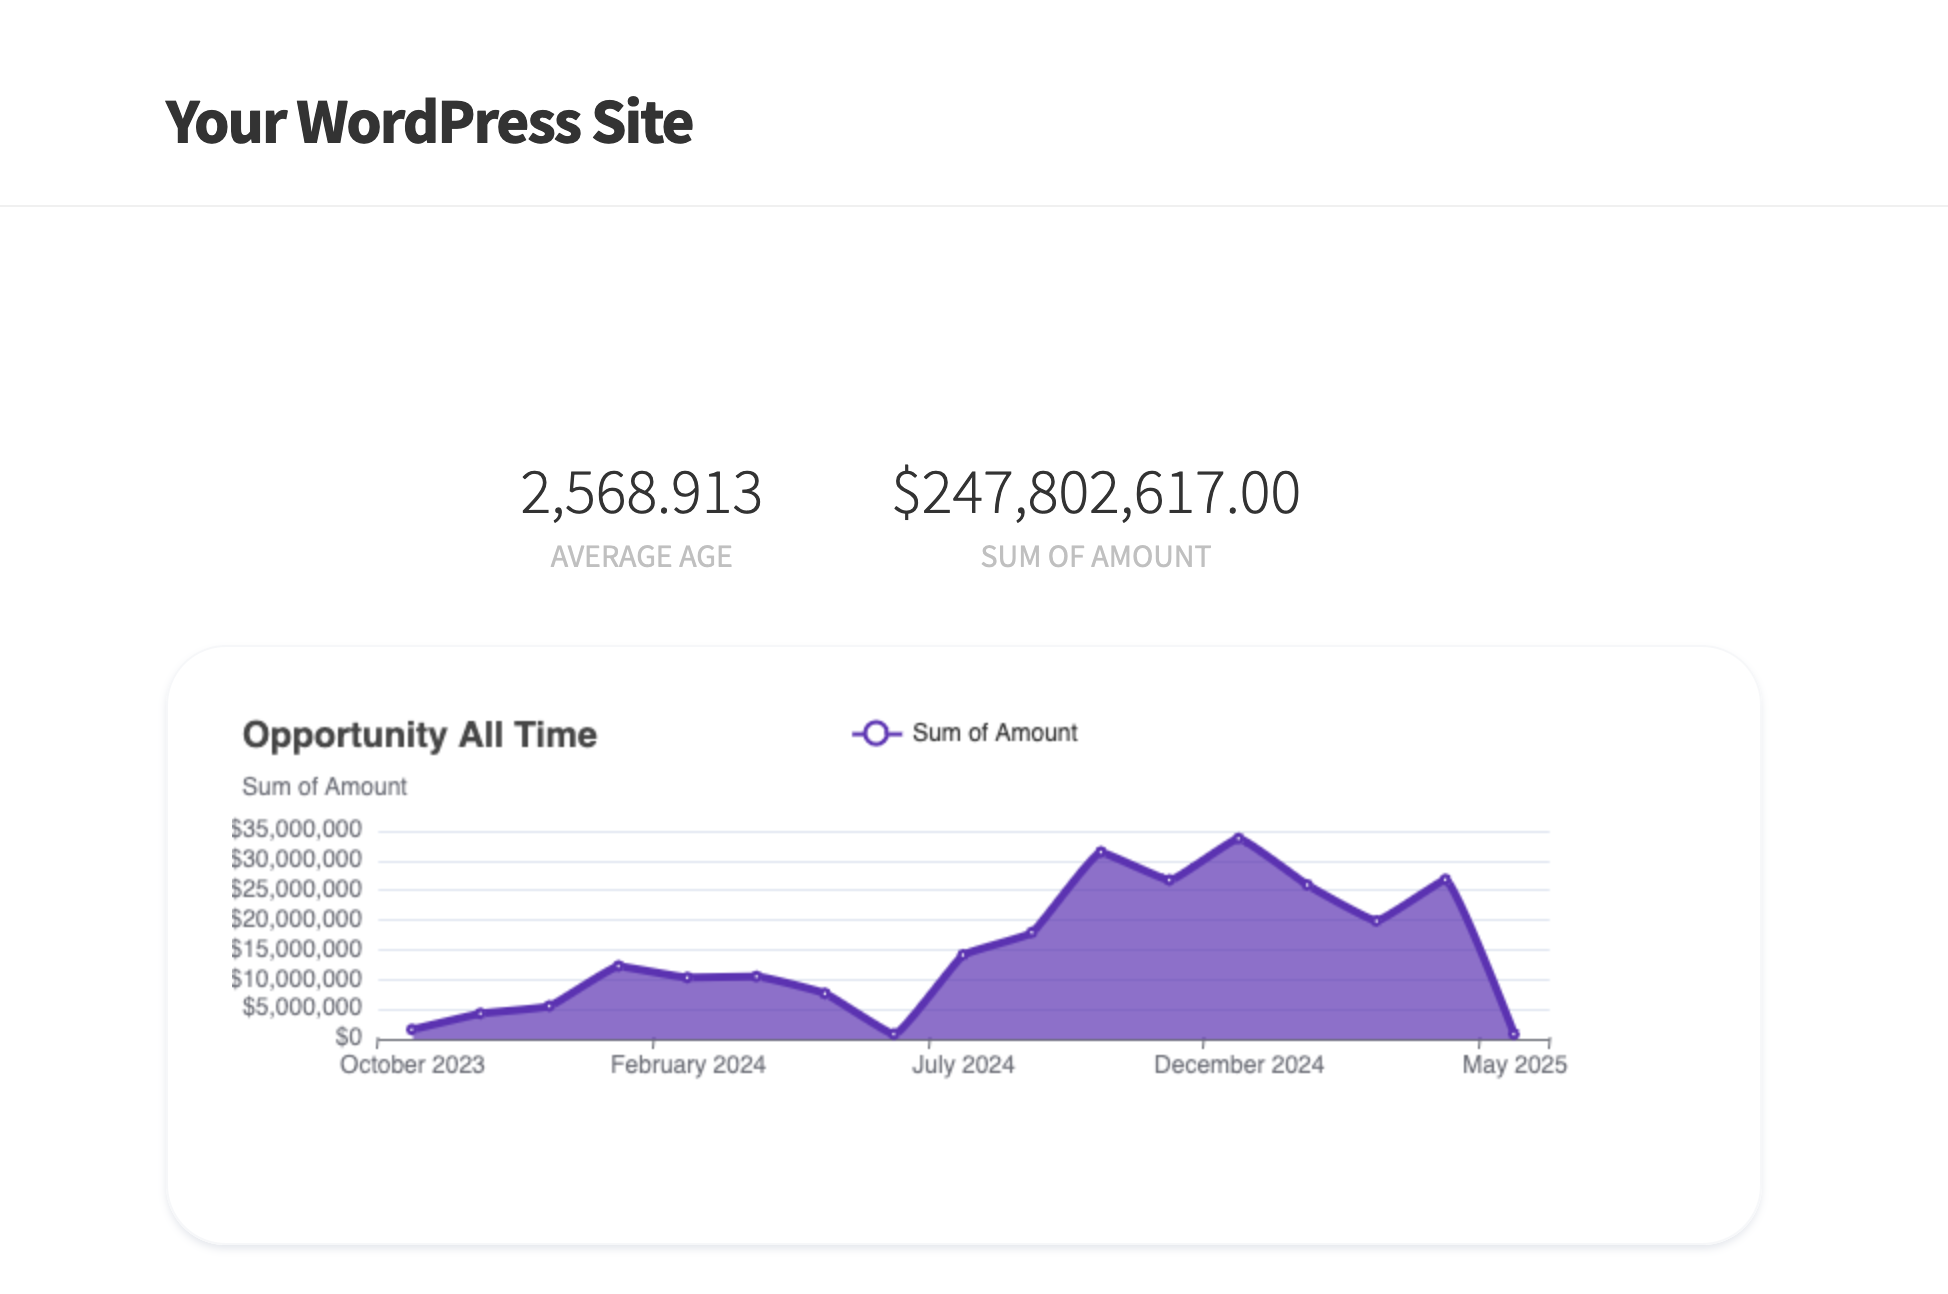
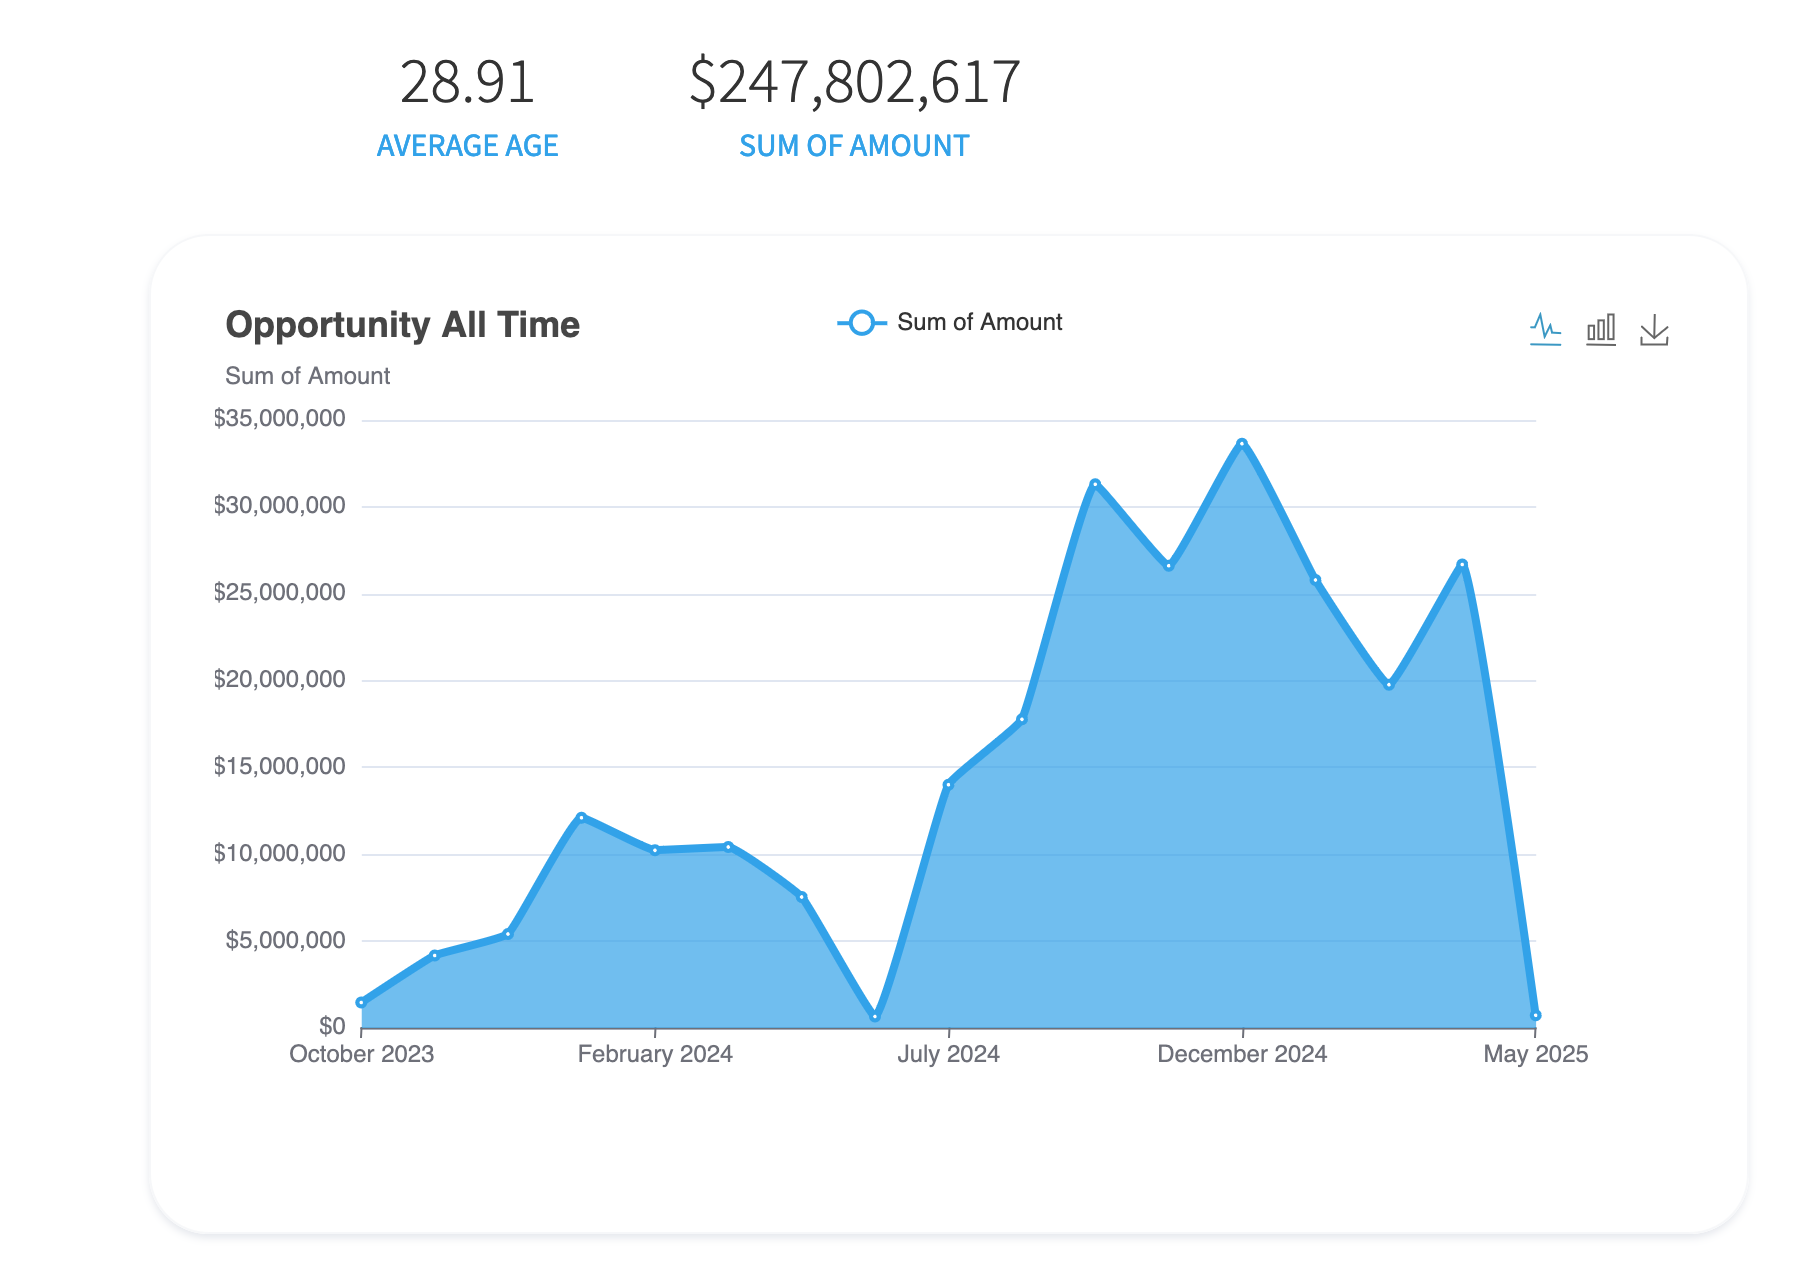
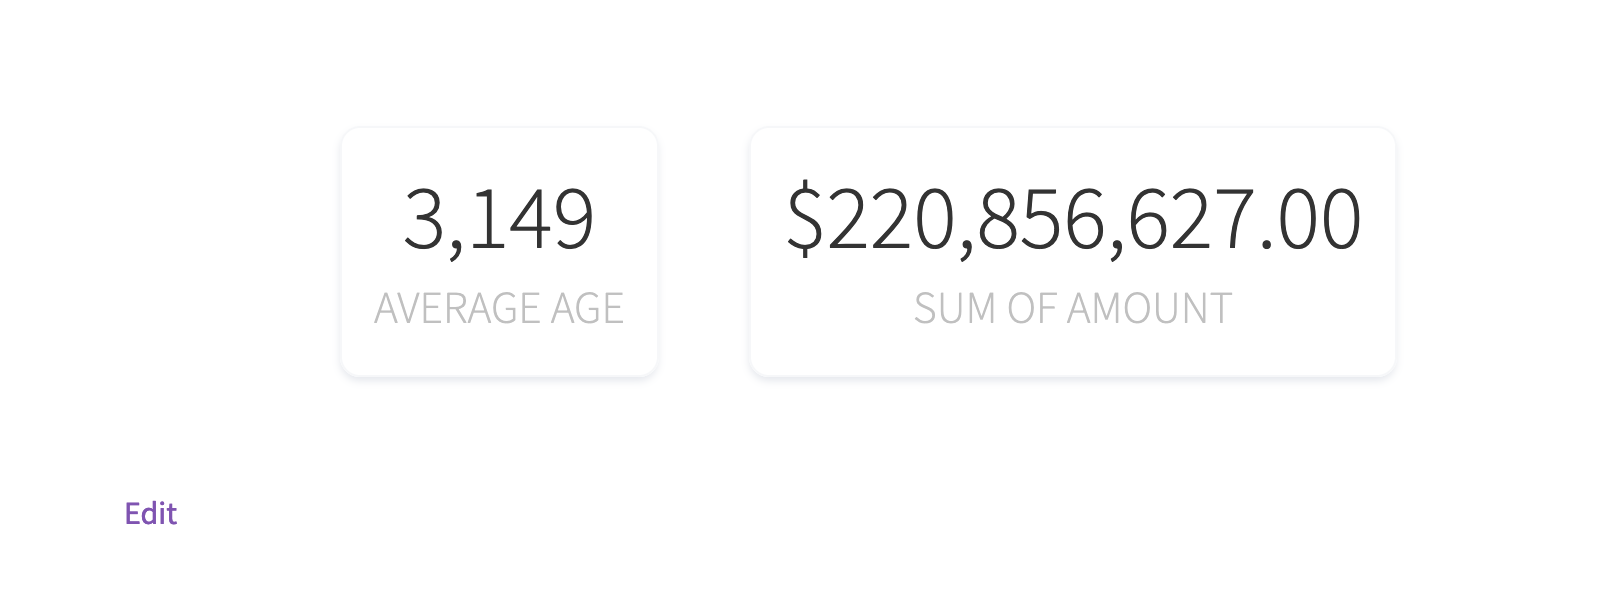
Let’s start with the basics. You can show the totals at the top of the report. This replicates the same group summaries that’s there on the report.
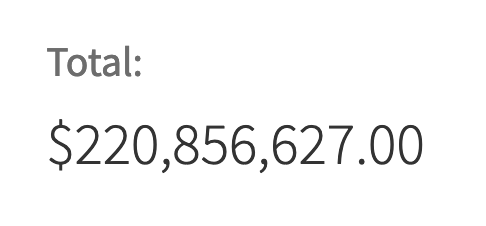
You can also select a specigic metric and only show that number. The shortcode below loads the second summarized total (Sum of Amount).
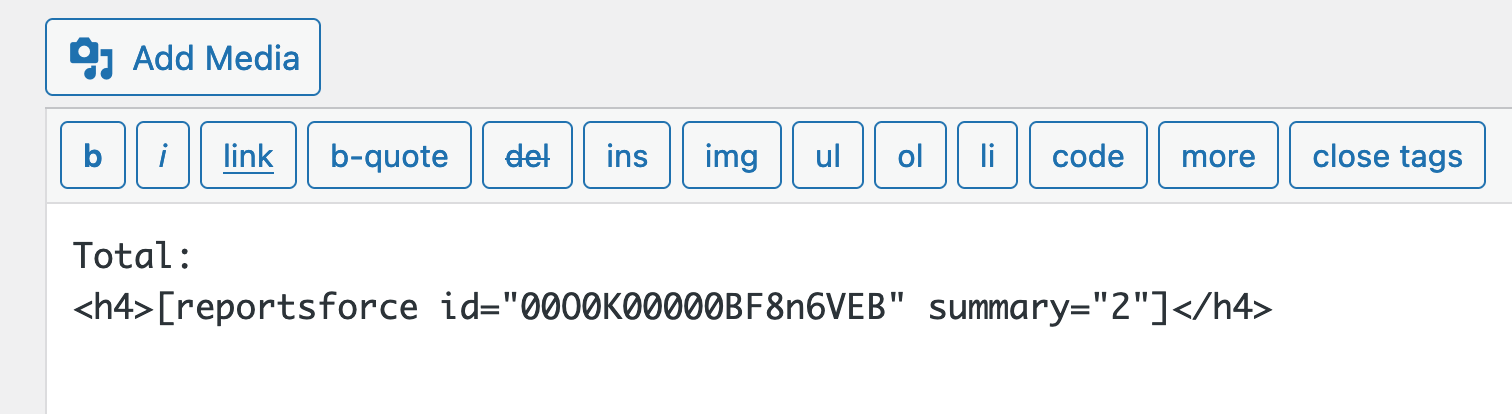
The elements are added with a shortcode, so they load along with the website content and not as an embed. This means they can be styled and customized as you like!
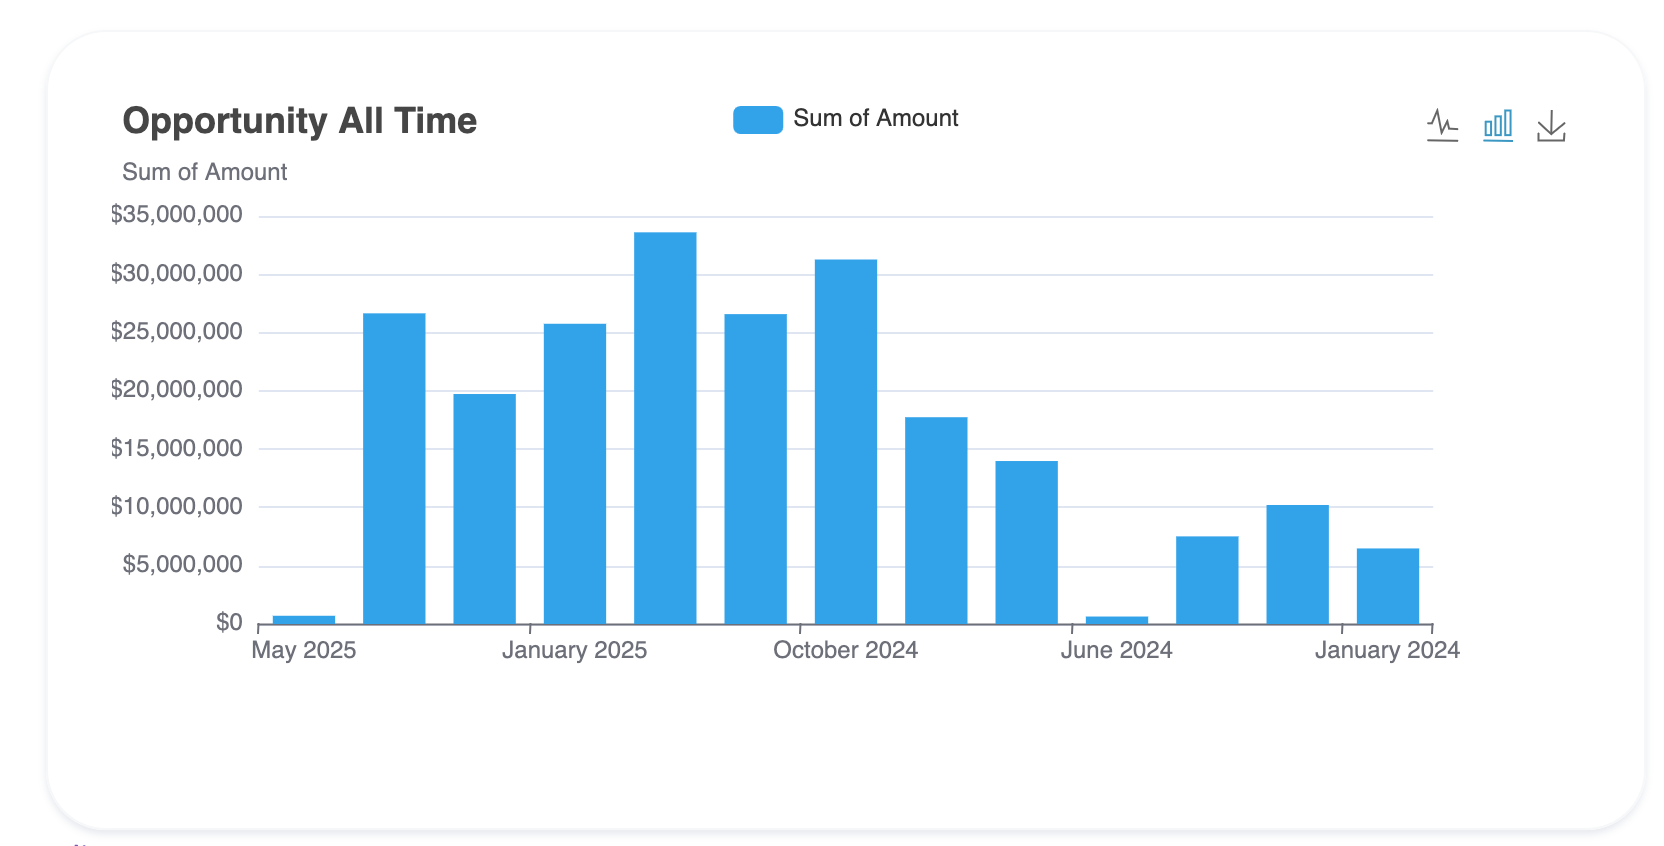
The basic bar chart without grouping can show the totals of each group
In the report there’s two groups (Type and Account Name), you can switch between either to create stacked charts.
You can also switch this chart to stack as lines and area layouts.
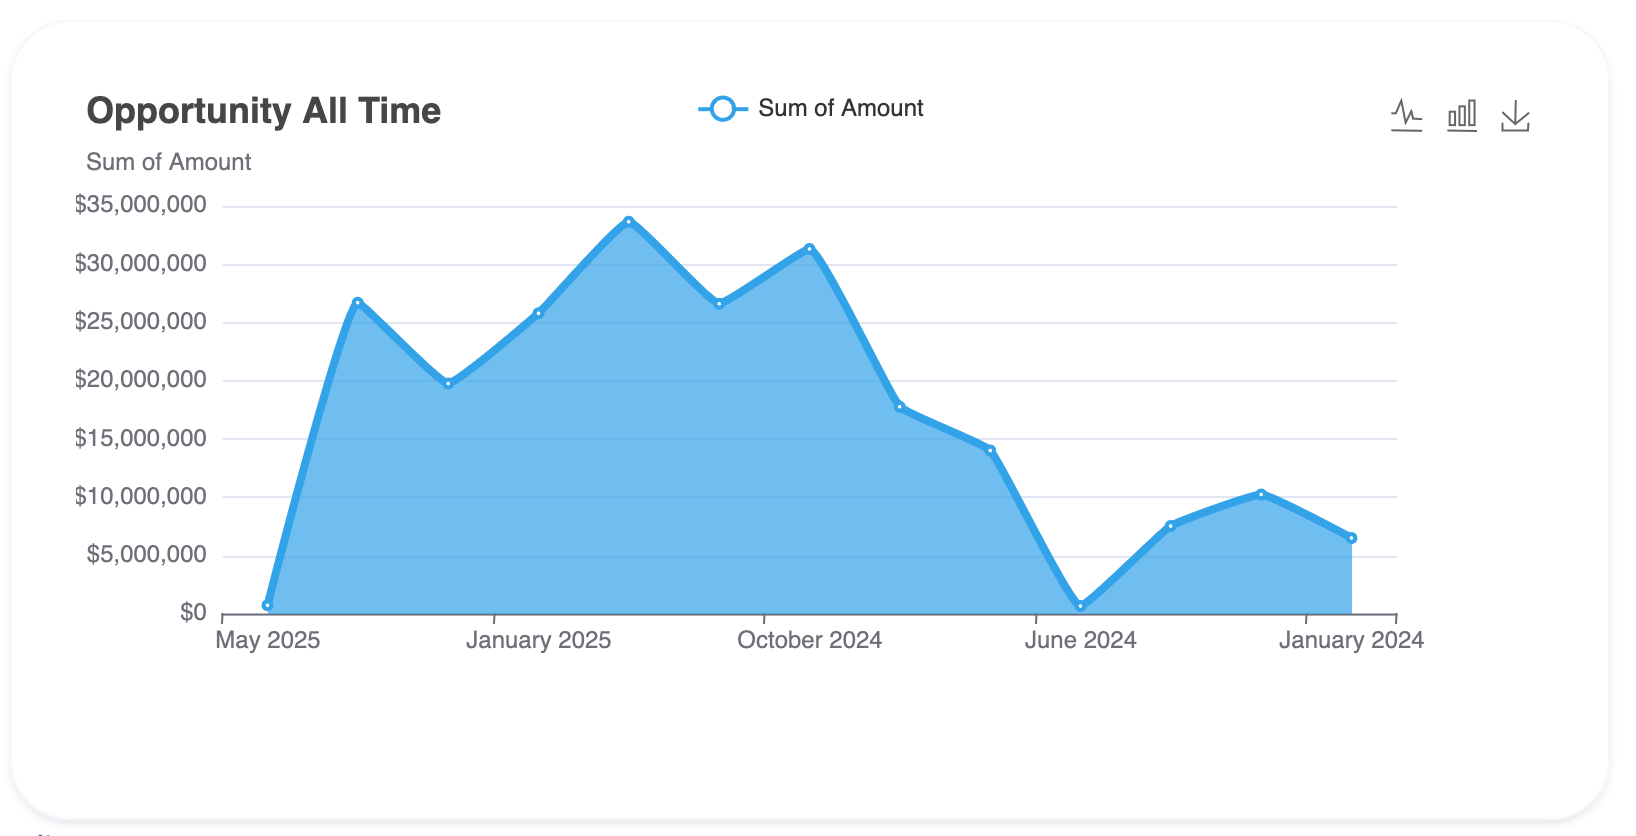
Set the shortcode as line or area for a smoother layout.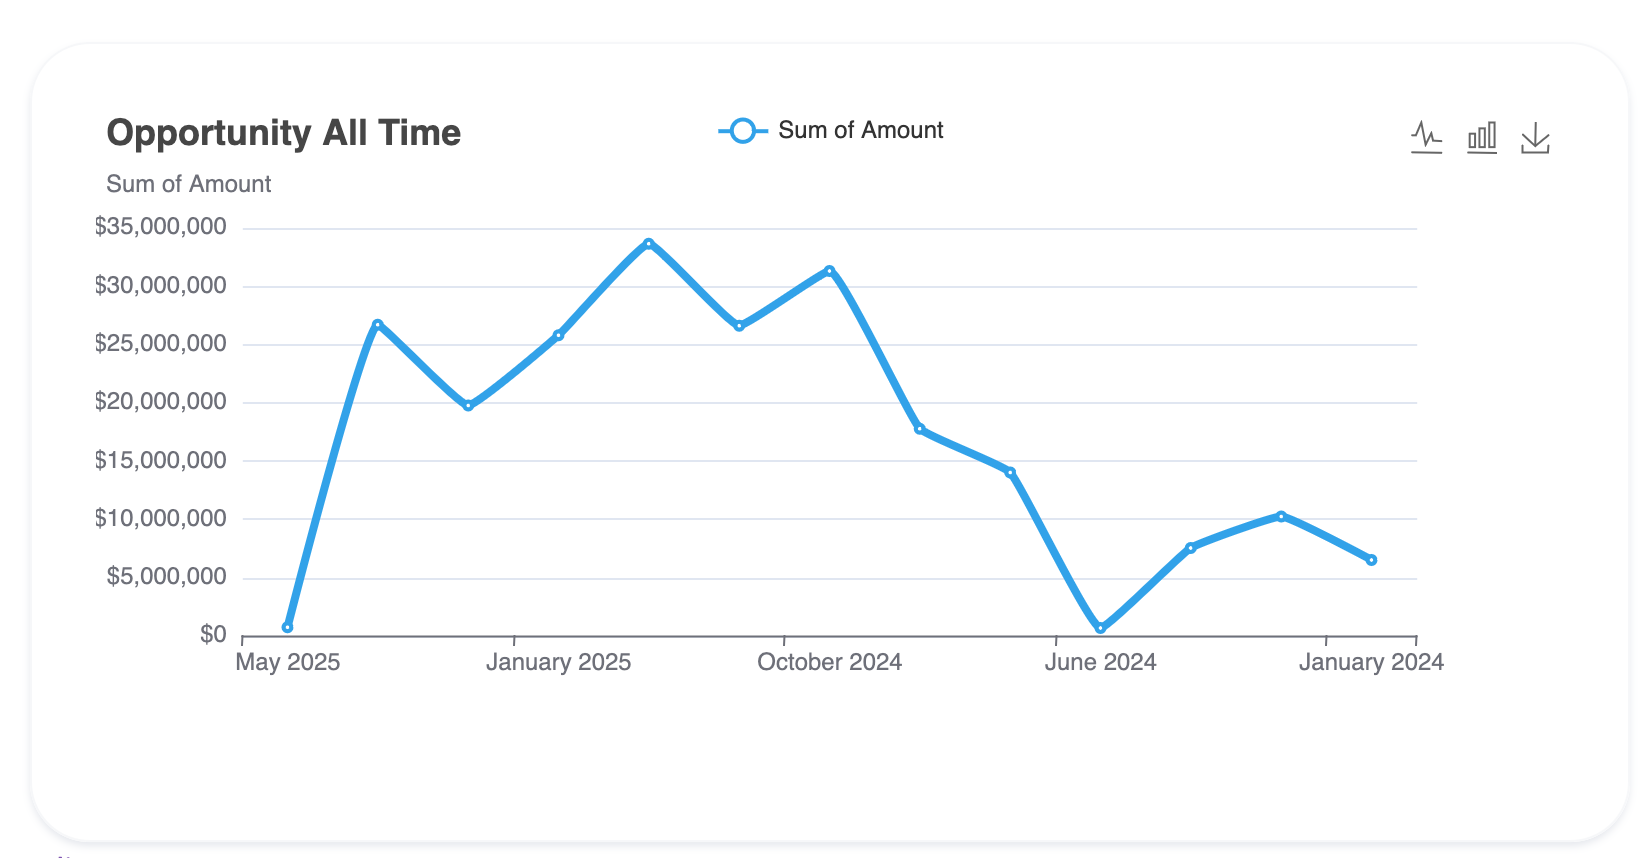
Area is one of our favorites.
Yes, you can match each chart to the color of your website theme as well to blend in smoothly.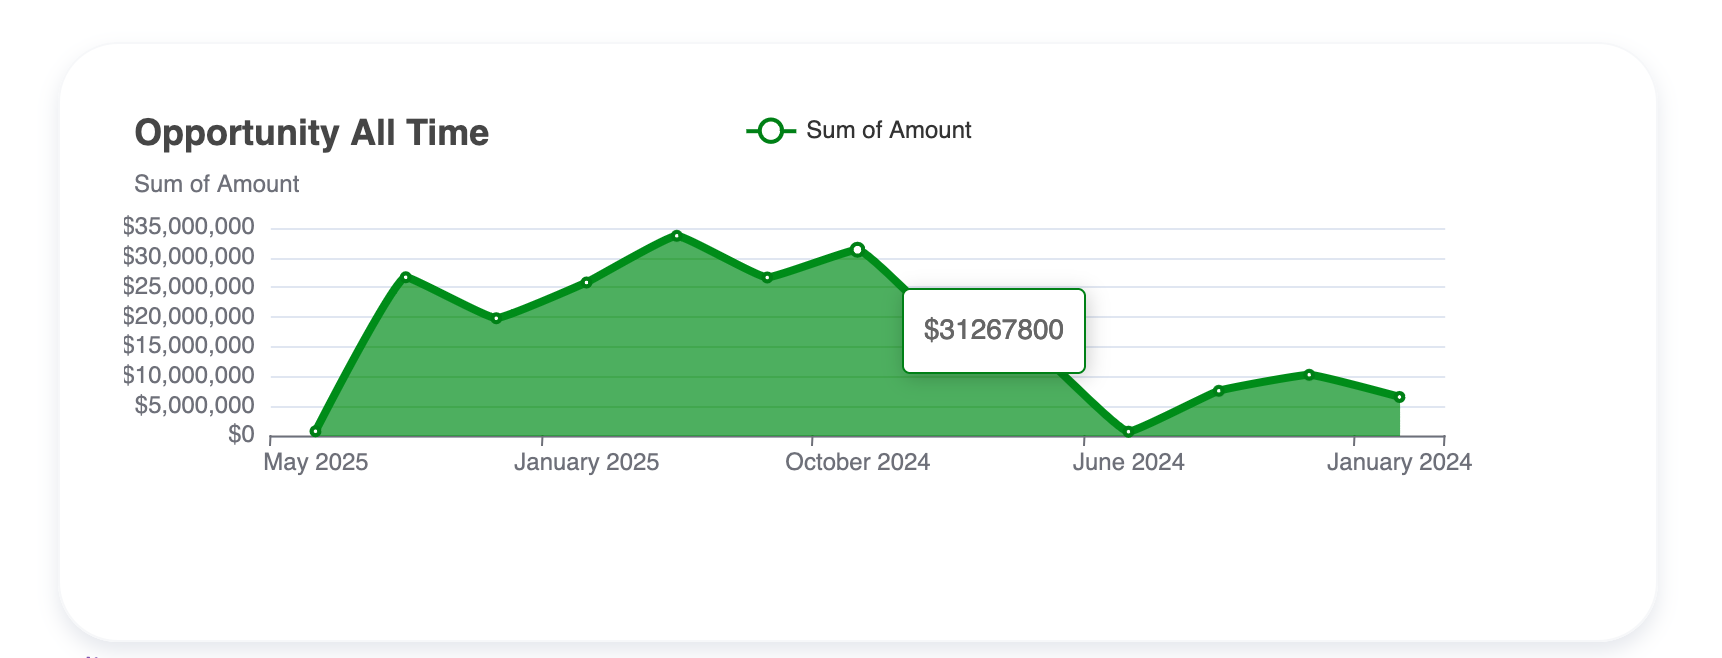
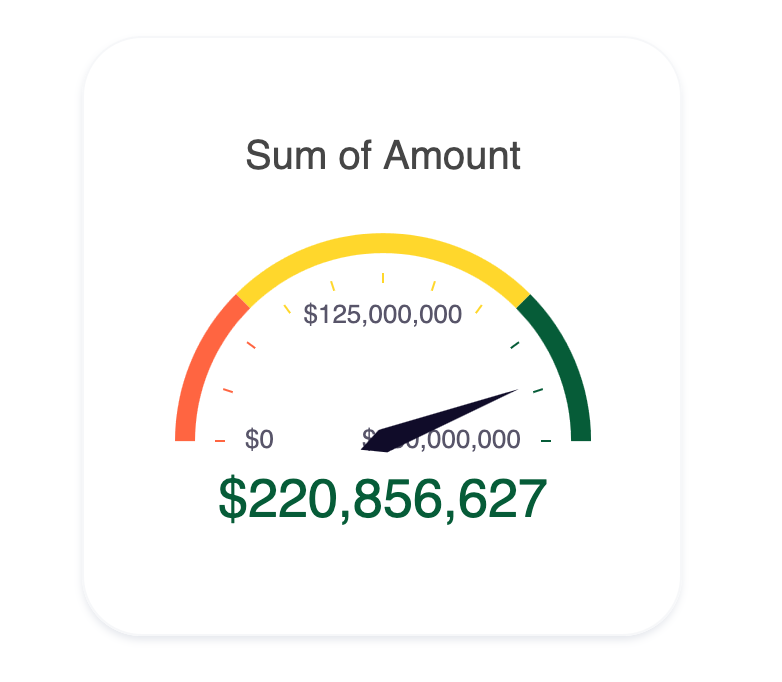
This is ideal to show progress or performance v/s the target. The plugin loads the Summarized Total value at the top of your report on the gauge. You can specify the goal in the shortcode, eg:
goal="250000000"
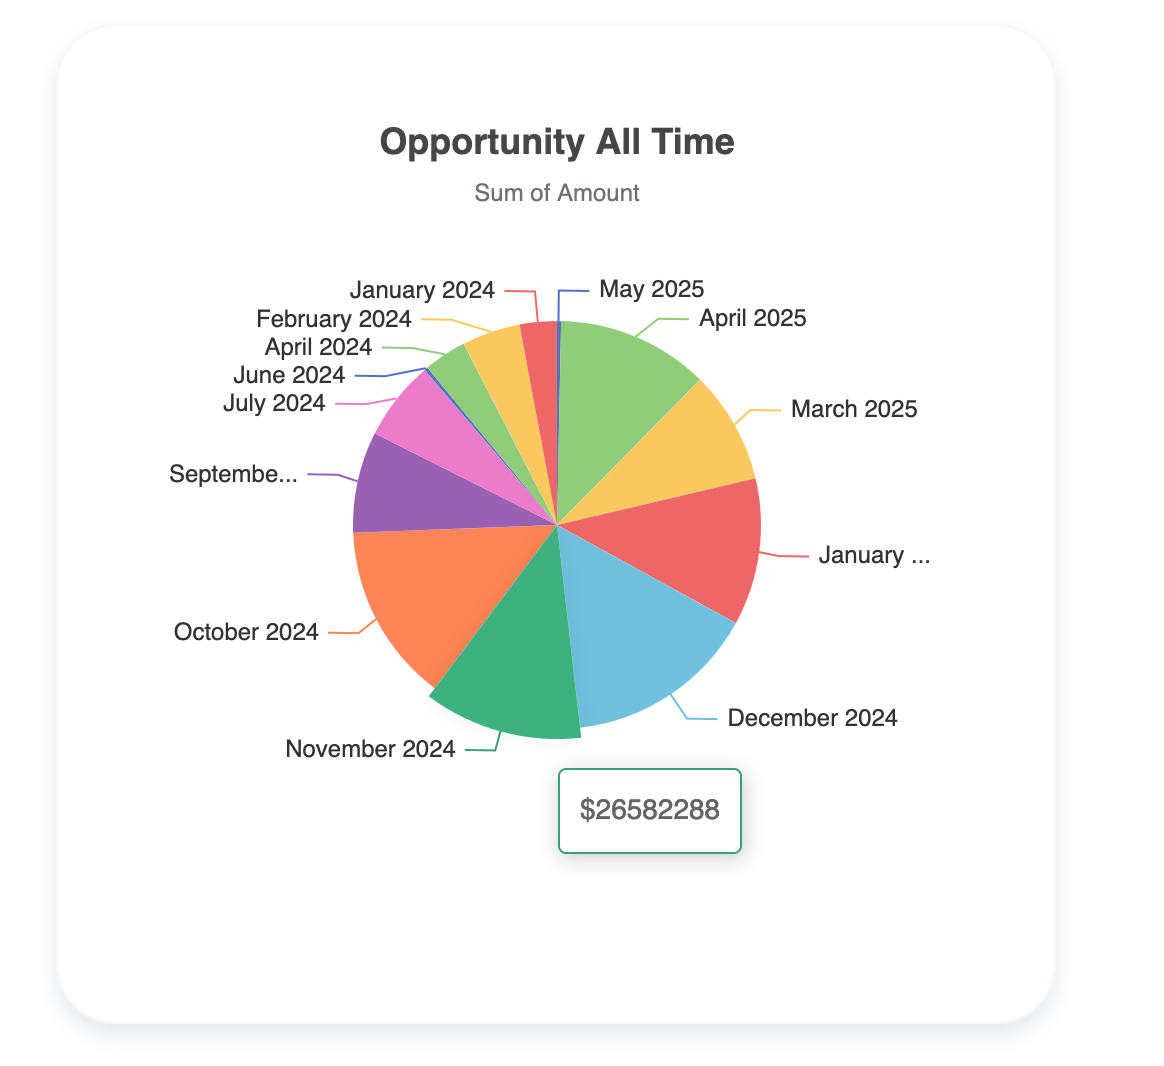
Pie charts work on all summarized charts, you wouldn’t need a grouping.
Or Doughnut!
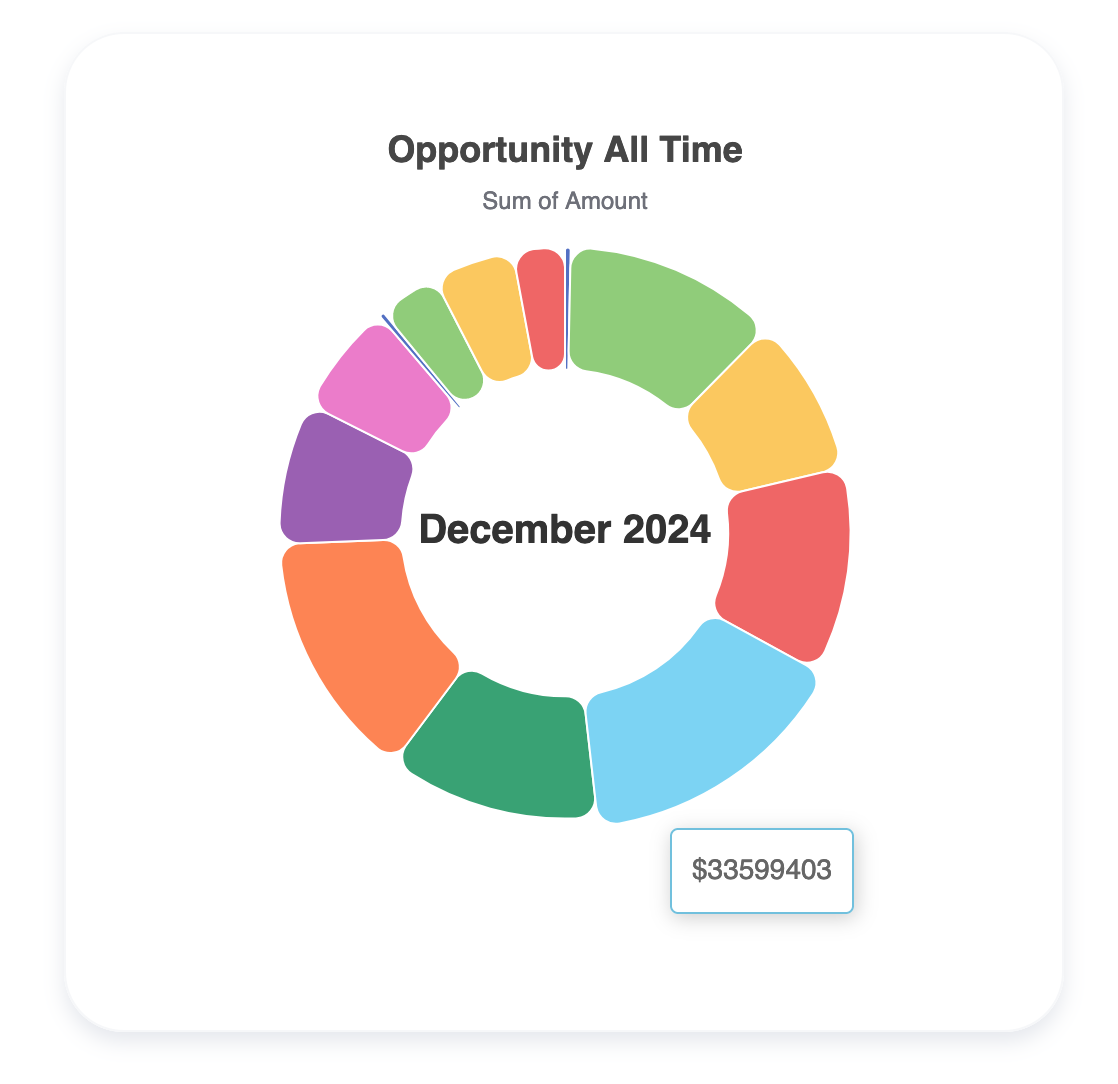
Works similar to pie but with space to show the category within the chart.
Curious to try these out on your site?
You can set up a quick page on YOUR website within minutes and share with your team!
Download the Plugin or Start a free trial.
In addition to reports you can also show records of custom and standard objects – in card, calendar, table layouts.
Currently, 150+ organizations similar to yours are using the Sawfish plugin to create intuitive websites using real-time Salesforce info!
Need help setting it up? Just send us a quick email and we’ll set up this feature for your website in minutes! No extra charges. 🙂